Mystery Epicenter
Determining where earthquakes start
Teacher feature
This activity was developed, produced and tested with 6th grade science teacher Felicia Ryder and her Earth science classes at Wangenheim Middle School in Mira Mesa, California.

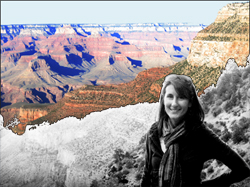
Felicia checks out the actual topography of the Grand Canyon.

Felicia checks out the actual topography of the Grand Canyon.
Activity Summary
Students imagine themselves as a news reporter, seismologist and local resident. The local news team is sick and they've been asked to report on a recent quake. They must investigate, locate the epicenter and present their report.
- Students reflect on the spatial parameters of the situation.
- They utilize knowledge about the relationship between time, distance and velocity.
- They synthesize knowledge about seismic waves, the relationship between time.
- Students ..., present ...
Activity style and components
- Project-based
Where is the epicenter?
- Multidisciplinary components -
Earth science - mapping, geomorphic features and relative size of features
Math - units, equations, rates
Physics - time, distance and speed; seismic waves
Technology - seismometers and seismograms
- Relevance
Hazards - earthquakes
- Skills
Application - arithmetic, graphing, trilateration
Analysis - error analysis and quality control
Observation systems - dependence on multiple sources of input
Communication - organization, audience assessment and presentation
Class settings, time and resources requirements
Time - About three class periods of 50 minutes each or two class periods or 100 minutes each.
Number of students accommodated - 1-36. See notes regarding how to conduct this activity with few students.
Wallspace - relatively large horizontal space at least one whiteboard wide.
Computers - one per 2-3 students.
Prerequisite knowledge
- Ability to use rulers and measure distance in feet and/or meters
- Understanding the nature of sound - its sources, how it propagates and behaves at interfaces by producing echoes
- Establishing the concept of velocity as a relationship between time and distance-traveled
- Discovering the mathematical relationship that relates velocity, time and distance
- Understanding the principle of echolocation
- Understanding the value of using a substitute measurement(proxy) such as echo-time to estimate rather than directly measure an unknown such as elevation.
- Defining a mathematical relationship (equation) to solve for an unknown based on a conceptual understanding of spatial relationships
- Learning how to account for units in equations.
- Reading about bats and echolocation.
New
| Reading an analog clock | |
| • | Reading an analog clock |
| • | Graphing |
Graphing |
|
| • | Interpolation |
| • | Reading data points |
| • | Making your own graph |
| The connection between mathematical and graphical representations of phenomena | |
| • | Velocity |
| • | Rearranging variables |
| • | Slope |
Determination of seismic risk |
|
| • | Faults and earthquakes |
| • | Structural engineering |
| • | Engineering solutions for seismic safety and preservation of culturally valuable places |
Project info:
| This activity was produced by Earthguide, the Center for Ocean Sciences Education Excellence (COSEE) - California, and the Enhancing Science Education Through Technology (ESETT) program at the EdTech Department at San Diego Unified School District (SDUSD). Teacher - Felicia Ryder at Wangenheim Middle School, San Diego Unified School District. Educator/web developer - Memorie Yasuda at Earthguide, Geosciences Research Division, Scripps Institution of Oceanography. Educational technologies resource teacher - Mike Senise at ESETT, San Diego Unified School District. Scientist - Dr. Cheryl Peach at COSEE and Scripps Institution of Oceanography. |